xmris is an xarray-based toolkit for Magnetic Resonance Imaging and Spectroscopy (MRIS).
If you have ever processed MR data in Python, you have likely written dozens of for loops to iterate over voxels, coils, or time points, all while carefully keeping track of raw numpy array dimensions in your head. This is what xmris tries to solve.
By keeping your multi-dimensional data permanently linked to its named dimensions (like "time" or "frequency"), physical coordinates, and metadata (like the spectrometer frequency), you can process entire datasets simultaneously — no loops, no positional axis indexing.
⚡ Quick Start: A Minimal Working Example
Because xmris functions return standard xarray objects, you can chain methods together to build readable, N-dimensional processing pipelines without writing a single for loop:
import numpy as np
import xarray as xr
import xmris  # Registers the .xmr accessor!

# 1. Create a dummy N-dimensional FID (e.g., 5 Voxels × 1024 Time points)
time = np.linspace(0, 1, 1024)
data = np.random.randn(5, 1024) + 1j * np.random.randn(5, 1024)

mrsi_data = xr.DataArray(
    data,
    dims=["voxel", "time"],
    coords={"voxel": np.arange(5), "time": time},
    attrs={"b0_field": 7.0, "reference_frequency": 300.15},
)

# 2. Process all voxels simultaneously using the .xmr accessor!
results = (
    mrsi_data
    .xmr.zero_fill(target_points=2048)
    .xmr.apodize_exp(lb=5.0)
    .xmr.to_spectrum()
    .xmr.autophase()
)

# 3. Fit the time-domain data using the pyAMARES integration
fit_dataset = mrsi_data.xmr.fit_amares(
    {"PCr": {"amplitude": 10.0, "chem_shift": 0.0, "linewidth": 15.0}}
)
Fitting has its own five-minute path in: Quick Start: Fitting a Spectrum.
🧠 How it Works: xarray + xmris
By simply importing xmris, standard xarray DataArrays instantly gain specialized MRIS functionality. You put an xarray in, apply a method, and get a processed xarray out.
What is xarray?
xarray is a Python library that builds labeled, N-dimensional arrays on top of numpy.
DataArray: The workhorse. It is a single, N-dimensional array just like anumpyarray, but it has named dimensions (e.g.,["voxel", "time"]), physical coordinate values, and metadata attached directly to it.Dataset: A dictionary-like container that holds multiple alignedDataArrayobjects. For example,xmrisfitting operations return aDatasetcontaining your raw data, the fitted model, and the residuals all perfectly synced together!
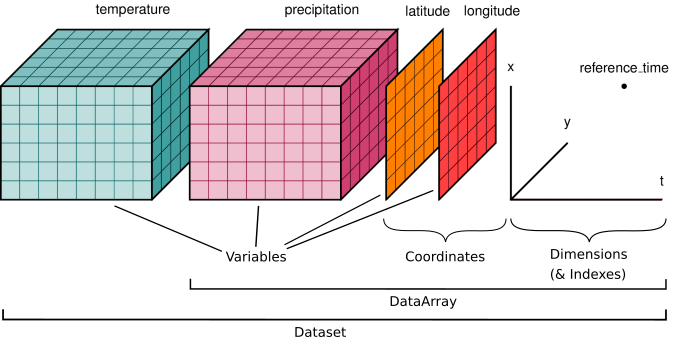
What exactly is an accessor?
An accessor is how xarray lets external packages attach custom methods directly to standard xarray objects. Conceptually, the division of labor looks like this:
Native xarray handles data wrangling:
da.mean(),da.sel(voxel=2),da.plot(), ...xmris handles the physics:
da.xmr.to_spectrum(),da.xmr.autophase(), ...
It is the exact same data object, meaning you never have to switch contexts or convert data types.
Here is a conceptual look at how your raw data might be structured and processed through the xmris pipeline:
🧭 Where do I start?
The sidebar has ten chapters. Here is what each one is for, so you can go straight to the one you need — every chapter title is also a page that summarises what is under it.
| Chapter | What is in it | Go here when |
|---|---|---|
| Basics | Complex data, the FFT, the FID↔spectrum round trip, the ppm axis | You are new — start here, in order |
| Concepts | The architecture, the controlled vocabulary, the two domains | You want to know why xmris is strict about names and metadata |
| Processing pipeline | Zero filling → apodization → phasing → baseline, one page per step | You have a FID and want a spectrum you can read |
| Fitting & simulation | AMARES quantification, prior knowledge, simulate_fid | You need numbers with error bars, not a picture |
| Visualization | Config-based plots and interactive widgets | You are building a figure, or want a slider instead of a scorer |
| Vendor formats | Bruker group delay and raw-file loading | Your data is still in whatever the scanner wrote |
| API reference | Every public function, generated from the docstrings | You know the function name and want its signature |
| Contribute | Setup, the Architecture Contract, one page per kind of change | You are opening a pull request |
| Dev diary | One entry per significant decision, told as a story | You found a design choice you cannot explain |
| Roadmap | What is shipped, in motion, and still being argued about | You are wondering whether to wait for something |
Every page in the first six chapters is an executable notebook: the plots and numbers you see were produced by the code above them, and they run on every pull request.
Not a chapter, and not in the sidebar: the changelog records what changed in each release, if you have just upgraded and something behaves differently. It lives under Project in the header.