If you have ever loaded a raw Bruker FID and found it starts with a strange, wavy flat stretch instead of a sharp spike — or watched an uncorrected spectrum spin like a corkscrew — you have met the digital-filter group delay. It is not a bad acquisition; it is a predictable byproduct of how the console digitizes and filters the signal.
This page explains where the delay comes from, removes it with remove_digital_filter, and — when the vendor header value turns out to be wrong — measures the true delay from the data with estimate_group_delay.
import numpy as np
import matplotlib.pyplot as plt

import xmris  # registers the .xmr accessor
from xmris.fitting.simulation import simulate_fid
1. The hardware pipeline
Modern Bruker consoles (the AVANCE NEO and relatives) are fully digital receivers. After the coil and preamplifier the signal is mixed down to an intermediate frequency and handed to a fast oversampling ADC (hundreds of MHz). The digital stream is then down-converted to a complex I/Q baseband — digital quadrature detection — and decimated to your requested sweep width through a cascade of CIC and FIR filters. The exact sampling rate and IF are hardware-dependent.
The decimation stage is where the delay is born.
2. Why the group delay is constant
The FIR filters are designed to be linear-phase — their impulse response is symmetric. Linear phase means a constant group delay: every frequency in the FID is held back by the same number of points, so the signal’s shape survives intact and is merely shifted in time.
Deep dive: group delay and linear phase
Group delay is , the derivative of a filter’s phase response. When that derivative is constant, the phase is linear in frequency and every spectral component is delayed by the same amount. A symmetric FIR of length has exactly this property, with a group delay of samples. (A CIC filter is symmetric too, so the whole chain stays linear-phase.)
If the delay were not constant — high frequencies emerging before low ones — the lineshape would smear and distort. Bruker avoids that by construction; the price is a single, well-defined time shift that we can undo exactly.
But a causal filter cannot emit its centre tap until its window has filled, so the output ramps up through a short, ringing transient before the true signal arrives. That is the “wavy flatline” at the start of a raw FID.
A pure time shift of samples is a linear phase across the spectrum. Over the full sweep width the phase winds through a complete turn times — for a typical high-resolution delay () that is roughly 76 turns of first-order phase. Left uncorrected, the real spectrum is an unusable corkscrew.
3. Simulate a raw Bruker FID
To see the effect cleanly we build our own “raw” FID: an ideal multi-peak signal from simulate_fid, pushed through a symmetric windowed-sinc FIR (the integer delay + startup transient) plus a fractional sub-point phase ramp. Three resonances are spread across the sweep width so the frequency-dependent phase error is visible.
Source
def make_raw_fid(peaks_hz, amps, delay, *, sw=5000.0, n=2048, damping=30.0, header=None):
    """Mimic a raw Bruker acquisition.

    Convolve an ideal multi-peak FID with a symmetric (linear-phase) windowed-sinc
    FIR to inject an integer group delay and its startup transient, then add the
    fractional sub-point delay via a Fourier phase ramp. ``header`` sets the value
    the console *reports* (which need not equal the true ``delay``).
    """
    ideal = simulate_fid(
        amplitudes=amps,
        frequencies=peaks_hz,
        spectral_width=sw,
        n_points=n,
        dampings=damping,
        reference_frequency=32.09,
        carrier_ppm=171.0,
    )
    int_delay = int(np.floor(delay))
    frac = delay - int_delay
    taps = 2 * int_delay + 1
    k = np.arange(taps)
    fir = np.sinc(0.5 * (k - int_delay)) * np.hamming(taps)  # symmetric -> linear phase
    fir /= fir.sum()
    raw = np.convolve(ideal.values, fir, mode="full")[:n]
    if frac:  # fractional sub-point delay via a Fourier phase ramp
        freqs = np.fft.fftfreq(n)
        raw = np.fft.ifft(np.fft.fft(raw) * np.exp(-1j * 2 * np.pi * freqs * frac))
    da = ideal.copy(data=raw)
    if header is not None:
        da.attrs["group_delay"] = header  # what the console reports
    return da
peaks_hz = [20.0, 436.0, 651.0] # three resonances across the sweep width
amps = [1.0, 0.6, 0.8]
# A well-behaved acquisition: the reported delay matches the true one.
raw = make_raw_fid(peaks_hz, amps, delay=76.125, header=76.125)
fig, ax = plt.subplots(figsize=(8, 3.2))
raw.real.plot(ax=ax, label="raw (real)")
ax.set_xlim(0, 0.03)
ax.set_title("Raw Bruker FID — the filter transient before the true signal")
ax.legend()
plt.show()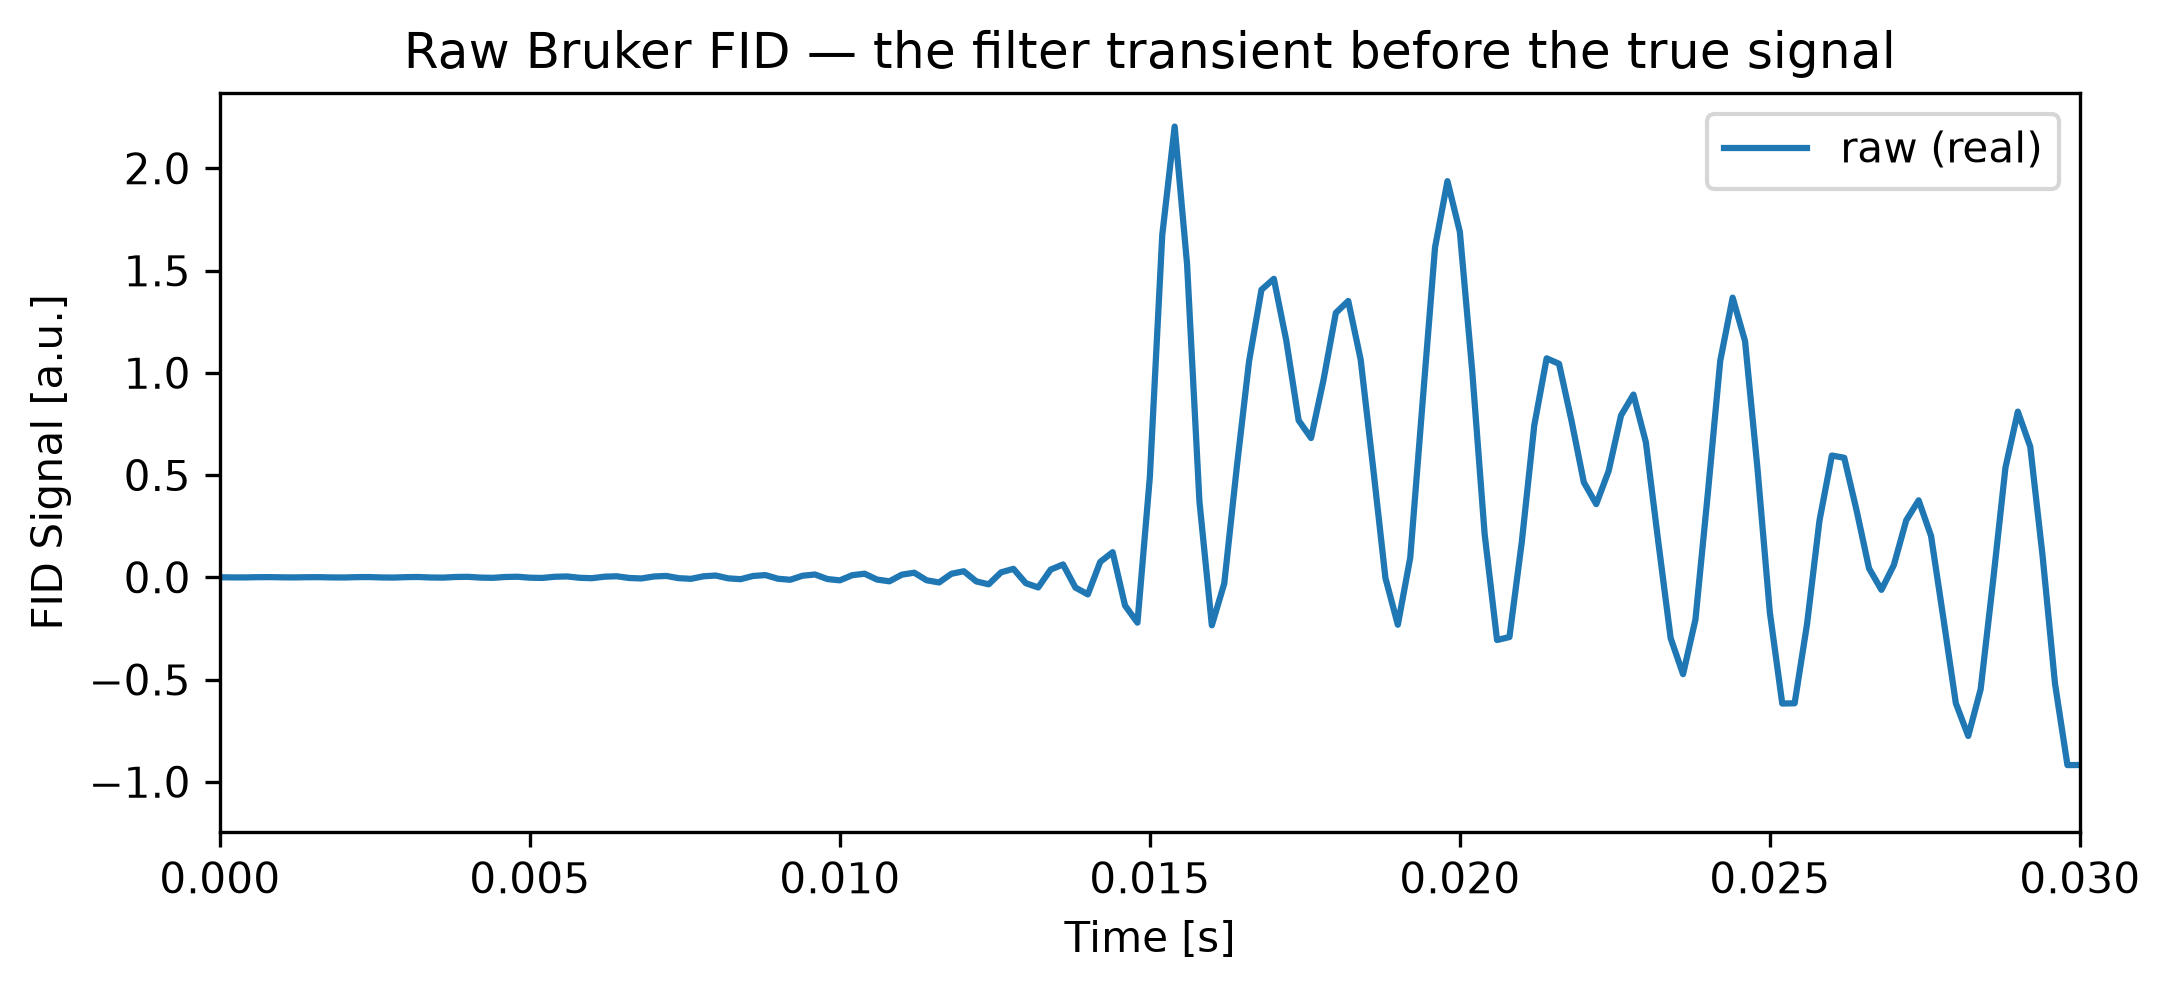
4. Correct it with remove_digital_filter
remove_digital_filter undoes the delay in three moves: it slices off the integer part of the delay (the transient points), applies a first-order phase ramp for the leftover fractional sub-point, and — with keep_length=True — zero-pads the tail so the array length (and FFT radix) is unchanged.
Because the Bruker loader stores the reported delay in attrs, the default group_delay="header" simply reads it:
clean = raw.xmr.remove_digital_filter()  # group_delay="header" reads the stored value
# equivalent to: raw.xmr.remove_digital_filter(group_delay=76.125)
fig, (ax_start, ax_end) = plt.subplots(1, 2, figsize=(11, 3.2), sharey=True)
raw.real.plot(ax=ax_start, alpha=0.5, label="raw")
clean.real.plot(ax=ax_start, lw=2, label="corrected")
ax_start.set_xlim(0, 0.03)
ax_start.set_title("FID start — transient removed")
ax_start.legend()
raw.real.plot(ax=ax_end, alpha=0.5, label="raw")
clean.real.plot(ax=ax_end, lw=2, label="corrected")
ax_end.set_xlim(0.39, 0.41)
ax_end.set_title("FID tail — zero-padded")
ax_end.legend()
plt.tight_layout()
plt.show()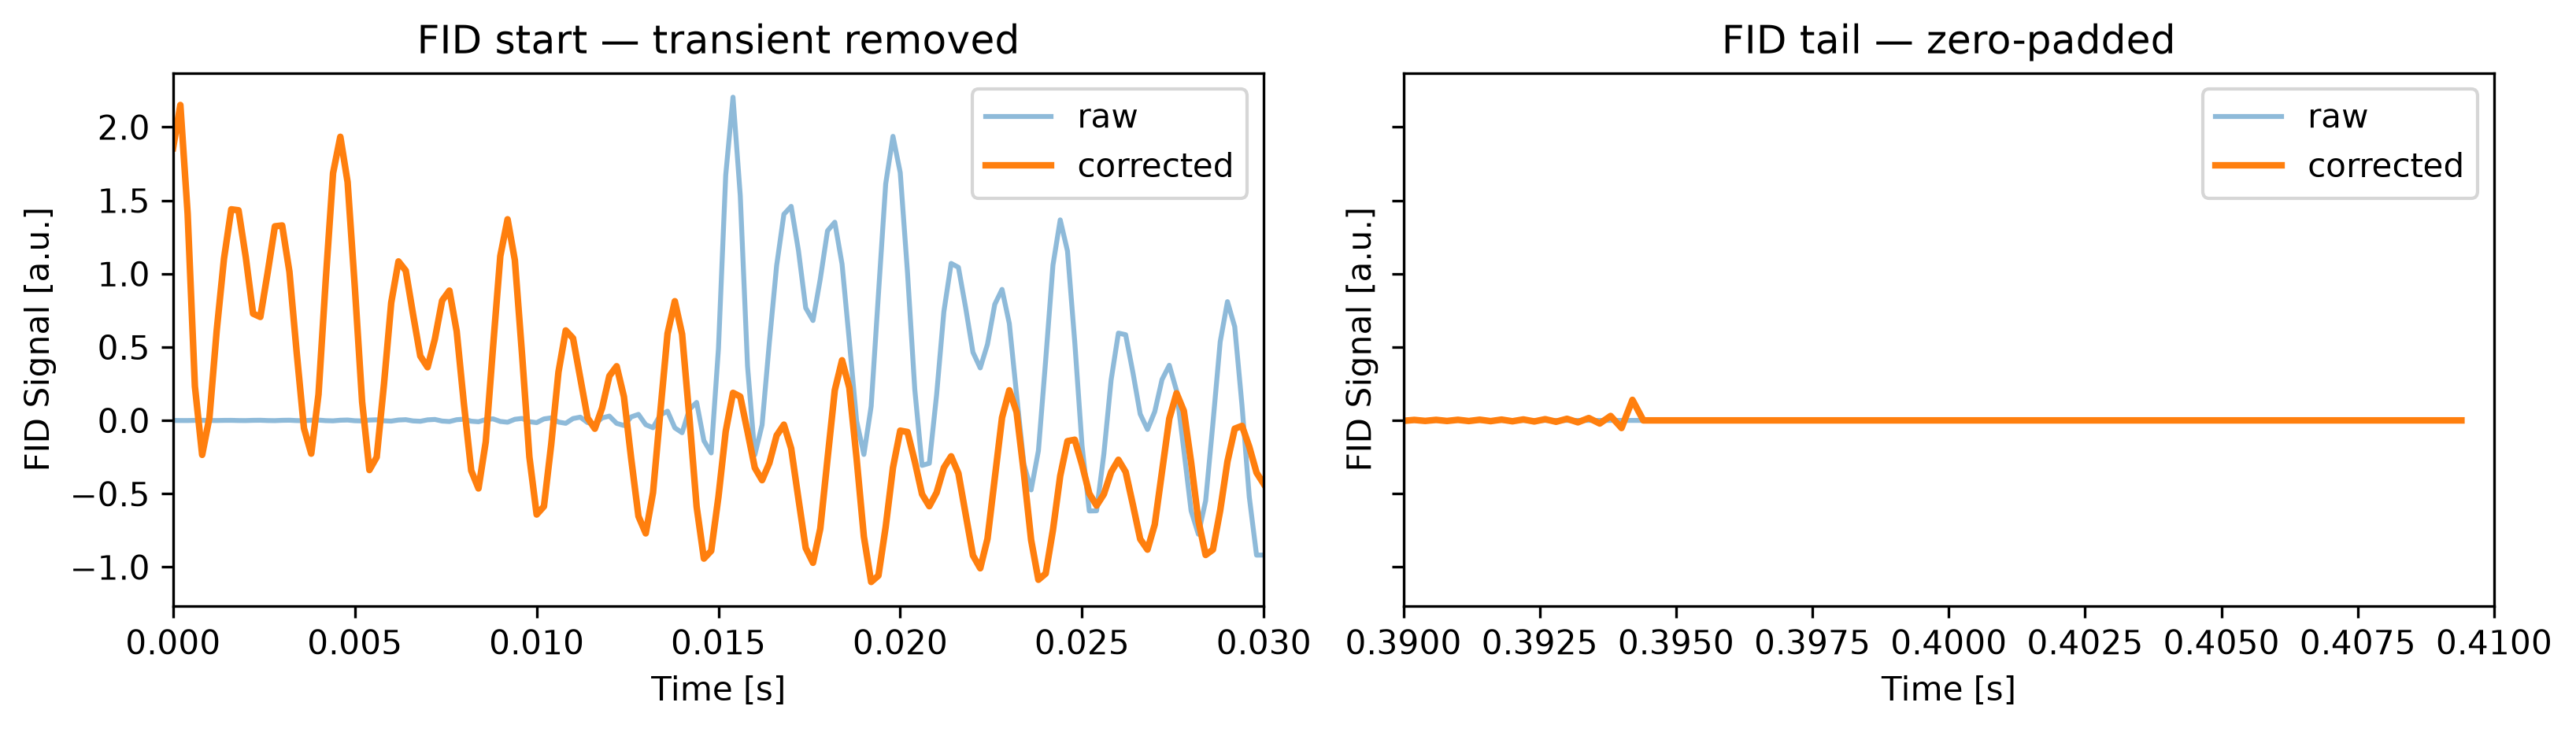
A time shift is a linear phase, so the naive real spectrum is a corkscrew. After removal the peaks are cleanly absorptive:
spec_naive = raw.xmr.to_spectrum()
spec_clean = clean.xmr.to_spectrum()

fig, (ax1, ax2) = plt.subplots(1, 2, figsize=(11, 3.6), sharey=True)
spec_naive.real.plot(ax=ax1, color="tab:red")
ax1.set_title("Naive FT (uncorrected)\nfirst-order phase corkscrew")
spec_clean.real.plot(ax=ax2, color="tab:blue")
ax2.set_title("After remove_digital_filter\nclean absorption")
plt.tight_layout()
plt.show()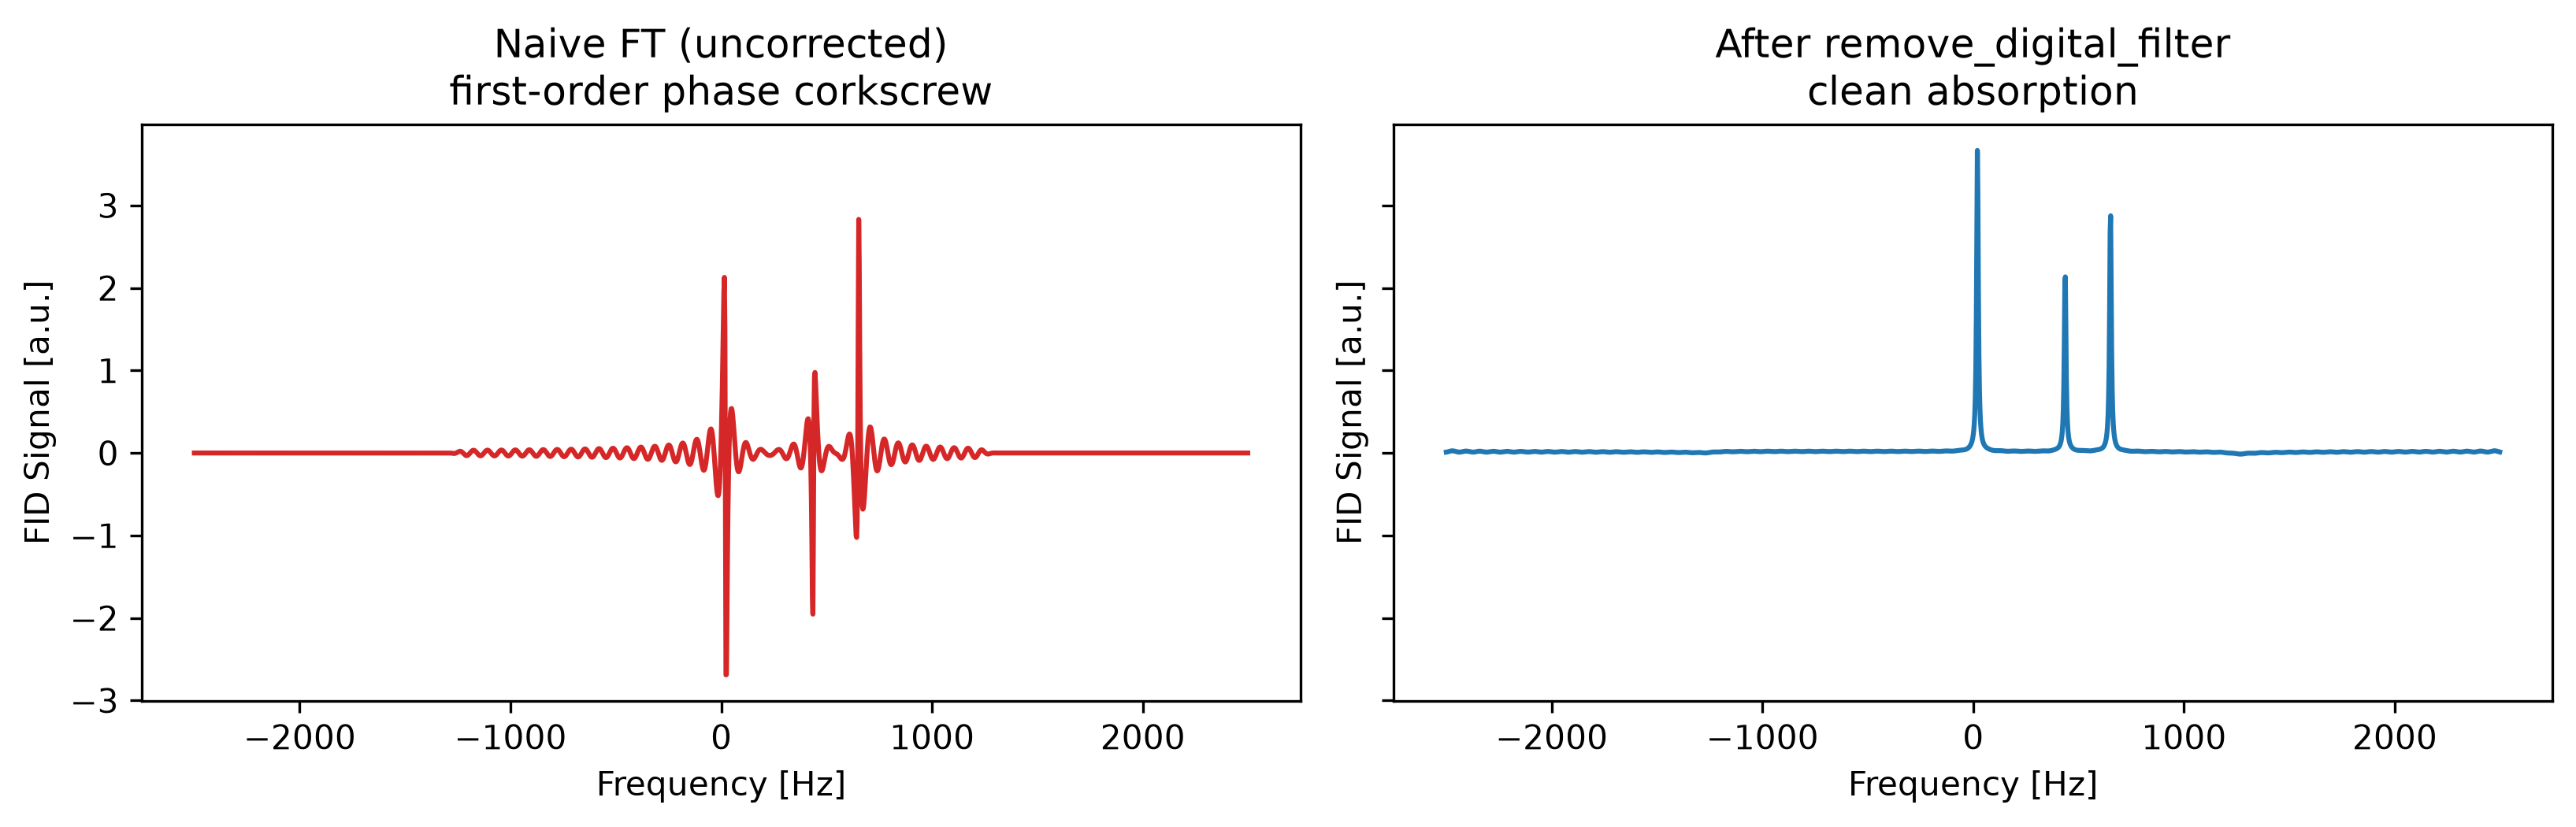
5. When the header lies: estimate_group_delay
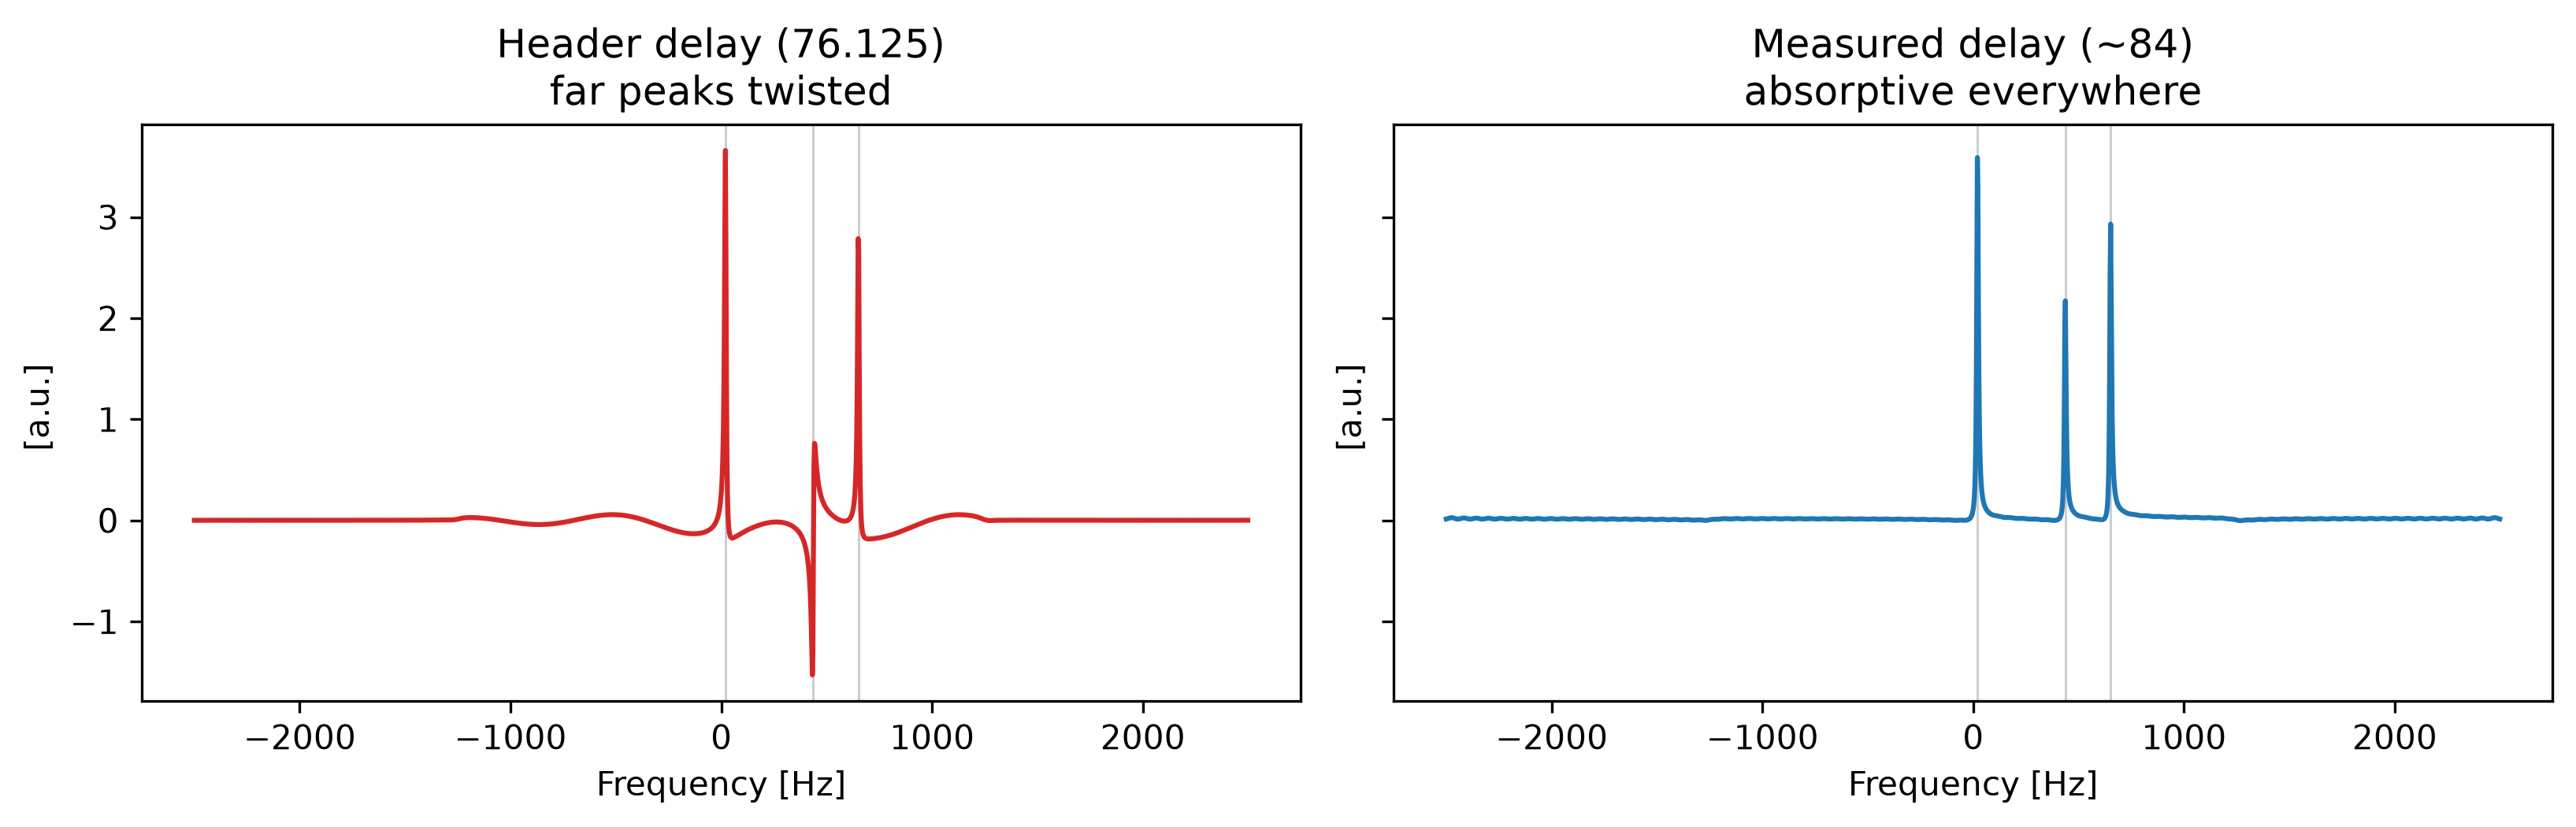
So far the header told the truth. For some ParaVision / probe combinations, though, the reported delay under-counts the real one — the console removes fewer transient points than it inserted. (This is an empirically-observed caveat, not documented Bruker behaviour.) What is left behind is a few samples of un-removed transient, i.e. a residual first-order phase
zero at the carrier but growing with offset, so peaks far from the centre are quietly twisted — enough to bias peak areas and tied-phase fits.
estimate_group_delay finds the delay that removes it: the value that makes the whole spectrum absorptive under a single zero-order phase. (argmax(|FID|) is not usable — it lands on the transient’s ringing, not the true delay.)
# A pathological acquisition: true delay 84, but the console reports only 76.125.
bad = make_raw_fid(peaks_hz, amps, delay=84.0, header=76.125)

# Reads the header as its search anchor; warns because the measurement contradicts it.
measured, profile = bad.xmr.estimate_group_delay(return_profile=True)

print(f"reported (header): {bad.attrs['group_delay']}")
print(f"measured (true)  : {measured:.2f} samples")
reported (header): 76.125
measured (true) : 84.10 samples
/home/runner/work/xmris/xmris/src/xmris/core/accessor.py:886: UserWarning: Measured group delay (84.096) deviates from the header value (76.125) by +7.971 samples; the header may under-count the true digital-filter delay for this acquisition.
  return estimate_group_delay(
The cost profile has a single sharp minimum at the true delay. The header sits ~8 samples short of it, and argmax(|FID|) lands on a ringing lobe:
argmax_fid = int(np.argmax(np.abs(bad.values)))

fig, ax = plt.subplots(figsize=(8, 3.6))
profile.plot(ax=ax, marker=".", color="tab:blue", label="residual-phase cost")
ax.axvline(measured, color="tab:green", lw=2, label=f"measured ({measured:.1f})")
ax.axvline(76.125, color="tab:red", ls="--", label="header (76.125)")
ax.axvline(argmax_fid, color="0.5", ls=":", label=f"argmax|FID| ({argmax_fid})")
ax.set_xlabel("trial group delay (samples)")
ax.set_ylabel("residual-phase cost")
ax.set_title("estimate_group_delay: cost vs. trial delay")
ax.legend()
plt.show()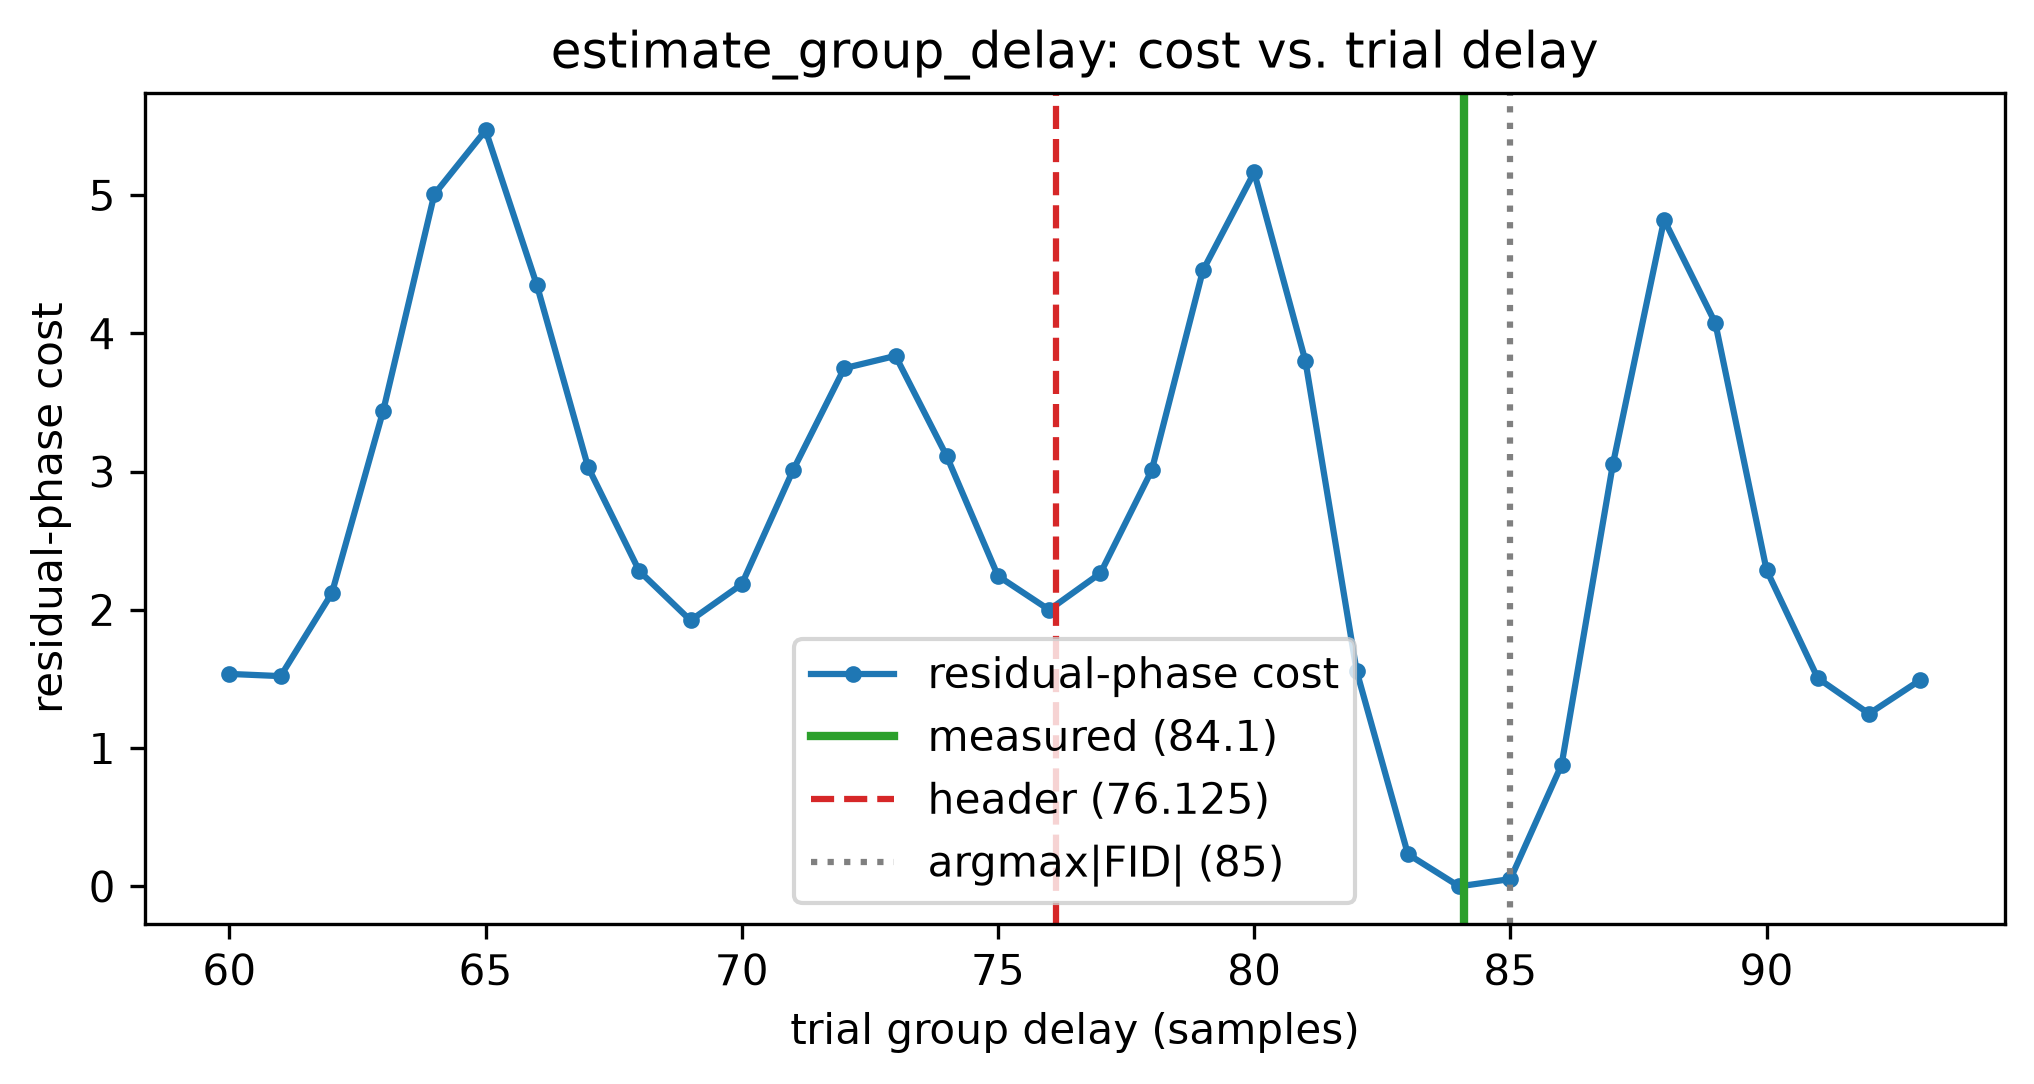
Remove each delay, transform, and apply only a zero-order phase (p0_only=True) so any residual first-order phase stays visible. The header value leaves the far peaks twisted; the measured value is absorptive everywhere. In a pipeline, group_delay="measure" does both steps at once.
spec_header = (
    bad.xmr.remove_digital_filter(group_delay=76.125)
    .xmr.to_spectrum()
    .xmr.autophase(p0_only=True)
)
spec_measured = (
    bad.xmr.remove_digital_filter(group_delay="measure")  # measure, then remove
    .xmr.to_spectrum()
    .xmr.autophase(p0_only=True)
)

fig, (axh, axm) = plt.subplots(1, 2, figsize=(11, 3.6), sharey=True)
spec_header.real.plot(ax=axh, color="tab:red")
axh.set_title("Header delay (76.125)\nfar peaks twisted")
spec_measured.real.plot(ax=axm, color="tab:blue")
axm.set_title("Measured delay (~84)\nabsorptive everywhere")
for ax in (axh, axm):
    for _f in peaks_hz:
        ax.axvline(_f, color="0.8", lw=0.7, zorder=0)
plt.tight_layout()
plt.show()
/home/runner/work/xmris/xmris/src/xmris/vendor/bruker.py:164: UserWarning: Measured group delay (84.096) deviates from the header value (76.125) by +7.971 samples; the header may under-count the true digital-filter delay for this acquisition.
measured = estimate_group_delay(da, dim=dim)